FE515 – Pre-Note and Excel Practice
Mathematical Foundations
What dose Econometrics mean and why we learn Econometrics ?
Econometrics is a branch of economics that uses statistical methods to analyze and model economic relationships. The goal of econometrics is to estimate and test economic theories and make predictions about economic outcomes.
We learn econometrics because it provides us with tools to empirically test economic theories using real-world data. Econometric methods allow us to quantify the strength and direction of relationships between economic variables, identify causality, and make predictions about future economic trends. By learning econometrics, we can make more informed decisions in business, policy, and academic settings.
For example, econometric techniques can help answer questions like:
How do changes in interest rates affect investment and economic growth?
What is the impact of education on earnings?
What factors determine the demand for a particular product?
What are the long-term effects of government policies on economic outcomes?
By using econometrics to answer these types of questions, we can gain a better understanding of the complex economic world around us.
More about the importance of econometrics: https://www.investopedia.com/terms/e/econometrics.asp.
Is Financial Econometrics Different from Economic Econometrics’?
Yes, financial econometrics is a subfield of econometrics that focuses specifically on modeling and analyzing financial data, while "economic" econometrics is a more general term that encompasses the use of econometric methods to study a wide range of economic phenomena.
Financial econometrics involves the application of statistical and mathematical tools to analyze financial markets, financial institutions, and financial instruments. It often deals with the analysis of time-series data, such as stock prices, interest rates, and exchange rates, as well as panel data, such as firm-level data.
financial markets
financial institutions
financial instruments
time-series data
panel data
Economic econometrics, on the other hand, covers a broader range of economic topics, such as macroeconomic policy, labor markets, international trade, and development economics. It may also involve the use of time-series and panel data, but can also make use of cross-sectional and experimental data.
So while there is some overlap between the two fields, financial econometrics is more focused on the analysis of financial data, while economic econometrics has a wider scope, encompassing a broader range of economic topics.
What is time-series data and what is panel data ?
Time-series data is a type of data that is collected over time, where each observation corresponds to a specific time period. Examples of time-series data include stock prices, GDP, unemployment rates, and interest rates.
Time-series data can be used to identify trends, cycles, and seasonal patterns in the data, as well as to forecast future values. Time-series econometric techniques, such as autoregressive integrated moving average (ARIMA) models, can be used to analyze time-series data.
Panel data, also known as longitudinal data or cross-sectional time-series data, refers to a type of data that includes observations on multiple units (such as individuals, firms, or countries) over time. In panel data, each unit is observed at multiple time periods.
Panel data can be used to analyze both individual and time effects, as well as the interactions between the two. Panel econometric techniques, such as fixed effects models and random effects models, can be used to analyze panel data.
To give an example, consider a dataset on the performance of firms in a particular industry over time. Time-series data would consist of the annual financial statements for a single firm over time, while panel data would include the annual financial statements for multiple firms over time.
According to the Chris Brooks textbook what are the Steps Involved in Formulating an Econometric Model?
According to "Introductory Econometrics for Finance" by Chris Brooks, the steps involved in formulating an econometric model are as follows:
Identify the research question: Determine the economic or financial question you want to answer. This may involve developing a theory, testing a hypothesis, or making predictions.
Specify the model: Choose the variables that are relevant to the research question and specify the functional form of the model. This involves determining which variables are the dependent variables and which are the independent variables, and specifying how they are related.
Collect data: Collect data on the variables of interest. This may involve collecting data from published sources, conducting surveys, or using administrative data.
Estimate the model: Use statistical software to estimate the parameters of the model. This involves choosing an estimation method, such as ordinary least squares (OLS) or maximum likelihood (ML), and applying it to the data.
Check the assumptions: Check whether the model assumptions are met. These assumptions include linearity, normality, homoscedasticity, and absence of autocorrelation.
Interpret the results: Interpret the estimated coefficients and statistical significance. Determine whether the coefficients have the expected signs and whether they are statistically significant.
Use the model: Use the estimated model to make predictions, conduct policy simulations, or test hypotheses.
These steps provide a general framework for building an econometric model. However, the specific details of each step may vary depending on the research question and the data available.
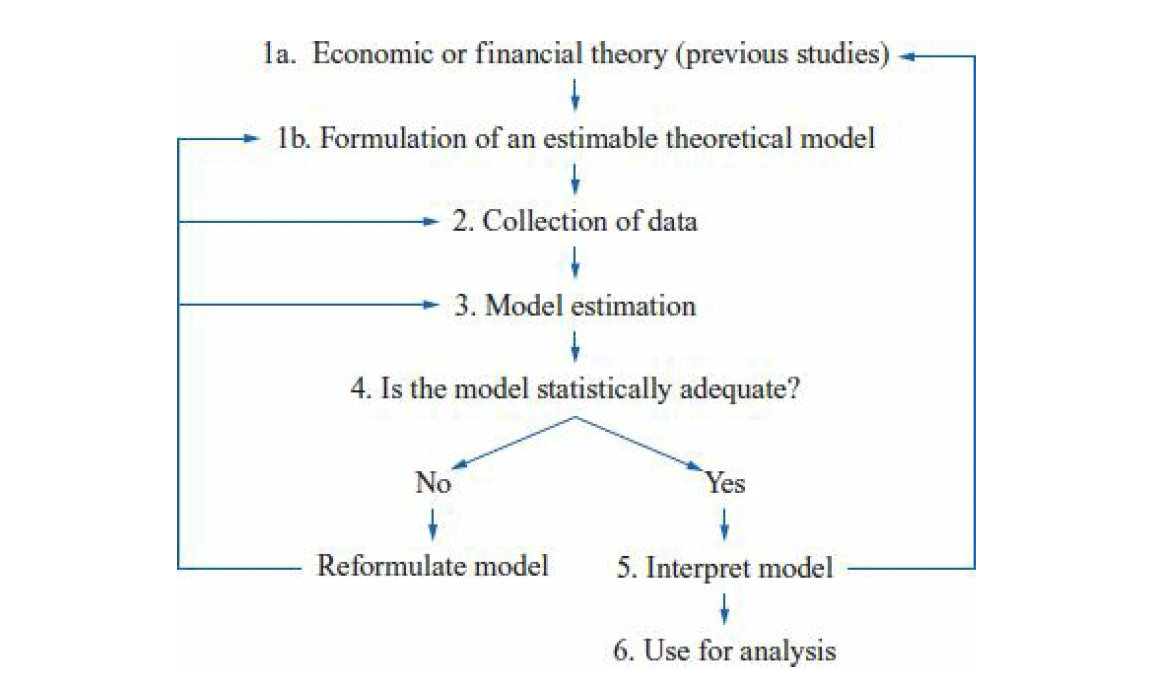
141Step 1: Identify the research question2|3Step 2: Specify the model4|5Step 3: Collect data6|7Step 4: Estimate the model8|9Step 5: Check the assumptions10|11Step 6: Interpret the results12|13Step 7: Use the model14
What are the Points to Consider When Reading Articles in Empirical Finance ?
When reading articles in empirical finance, there are several points to consider in order to assess the quality and validity of the research. Here are a few key points to keep in mind:
Data source and quality: Consider the data source and quality of the data used in the research. Was the data collected in a reliable and unbiased manner? Is the sample size large enough to ensure statistical significance? Are there any potential issues with the data, such as missing data or outliers?
Research design: Look at the research design and methodology. Is the research design appropriate for the research question being addressed? Is the methodology sound and appropriate for the data being used?
Model specification: Consider the model specification used in the research. Are the variables relevant to the research question being addressed? Is the functional form of the model appropriate?
Results and statistical significance: Evaluate the results and statistical significance. Do the results make sense? Are the estimated coefficients statistically significant? Is the statistical method used appropriate for the type of data being analyzed?
Robustness checks: Look for robustness checks that test the sensitivity of the results to changes in the research design, methodology, or model specification. Are the results robust to changes in these factors?
Conclusions: Consider the conclusions drawn from the research. Do the conclusions follow logically from the results? Are there any potential limitations or alternative explanations for the results?
By considering these points when reading articles in empirical finance, you can assess the quality and validity of the research and make informed decisions about how to apply the research findings in practice.
What dose Functions mean ?
In econometrics, a function is a mathematical relationship between one or more variables. Functions are used to describe the relationship between variables and to model the behavior of economic or financial variables.
Functions can take different forms depending on the nature of the relationship being modeled. For example, a linear function takes the form Y = a + bX, where Y is the dependent variable, X is the independent variable, a is the intercept, and b is the slope. A logarithmic function takes the form Y = a + b ln(X), where ln is the natural logarithm.
Functions can be used to estimate the parameters of a model and to make predictions about the values of the dependent variable based on the values of the independent variable(s). By using functions to model economic relationships, econometricians can test economic theories and make predictions about economic outcomes.
Functions are an important concept in econometrics, and understanding the different types of functions and how they can be used to model economic relationships is essential for conducting empirical research in economics and finance.
what is Polynomial Functions functions in the book ?
In "Introductory Econometrics for Finance" by Chris Brooks, a polynomial function is a function of the form:
where y is the dependent variable, x is the independent variable, and ε is the error term. The coefficients β0, β1, β2, ..., βk are the parameters of the model that are estimated from the data.
Polynomial functions are commonly used in econometrics to model nonlinear relationships between variables. The higher-order terms, such as
However, it's important to note that polynomial functions can sometimes suffer from overfitting, where the model fits the noise in the data rather than the underlying relationship. In such cases, other types of models, such as splines or nonparametric regression, may be more appropriate.
In summary, polynomial functions are a type of function used in econometrics to model nonlinear relationships between variables. They can be useful in capturing curvature in the relationship, but care must be taken to avoid overfitting.
Why use Logarithms ? what is their usecase ?
Logarithms are used in econometrics for a variety of reasons, but one of their primary uses is to transform data to make it more amenable to statistical analysis.
In particular, logarithmic transformations are often used when the data exhibit a nonlinear relationship that is better approximated by a linear relationship on the log scale. For example, in finance, stock prices are often modeled using a lognormal distribution, and taking the natural logarithm of stock prices can result in a distribution that is more symmetric and better approximated by a normal distribution.
Logarithmic transformations can also be useful for interpreting the coefficients of a regression model. When the dependent variable is transformed using a logarithm, the coefficients can be interpreted as elasticities, which represent the percentage change in the dependent variable associated with a one percent change in the independent variable. This can be particularly useful in economic analysis, where elasticities are often of interest.
Overall, logarithmic transformations are a powerful tool in econometrics for transforming data and for interpreting regression coefficients. However, it's important to use them judiciously, as they can also introduce their own complexities and assumptions into the analysis.
why use Differential Calculus ?
Differential calculus is used in econometrics for a variety of purposes, including:
Estimating the parameters of a model: Differential calculus is used to find the maximum or minimum of a function, which is often necessary to estimate the parameters of a model. For example, the method of maximum likelihood involves finding the values of the parameters that maximize the likelihood function, which can be done using differential calculus. Analyzing the properties of a function: Differential calculus is used to analyze the properties of a function, such as its slope, curvature, and inflection points. This can help econometricians understand the behavior of economic variables and relationships, and can also be used to test hypotheses and make predictions. Calculating elasticity: Differential calculus is used to calculate elasticity, which is a measure of the responsiveness of one variable to changes in another variable. Elasticity is an important concept in economics, and is used to measure the effects of policy changes and to inform decision-making. Optimal decision-making: Differential calculus is used to find the optimal decision in various economic contexts. For example, in consumer theory, differential calculus is used to find the optimal consumption bundle given a budget constraint and utility function. Overall, differential calculus is an important tool in econometrics, as it allows econometricians to estimate parameters, analyze functions, calculate elasticities, and make optimal decisions. It is an essential part of any econometrician's toolkit.
Here are some common formulas in econometrics that involve differential calculus:
The derivative of a function f(x) with respect to x:
The second derivative of a function f(x) with respect to x:
The elasticity of a function f(x) with respect to x:
The first-order condition for maximizing a function f(x):
The second-order condition for maximizing a function f(x):
Differentiation: the Fundamentals
Differentiation is a fundamental concept in calculus that involves finding the derivative of a function. The derivative of a function f(x) represents the rate of change of the function with respect to x, or the slope of the tangent line to the function at a given point.
The notation for the derivative of a function
In other words, the derivative of
There are several rules and properties of differentiation that are important to understand in econometrics, including:
The power rule: If
Statistical Foundations
The probability distribution function for the sum of two dice
The probability distribution function for the sum of two dice is a discrete probability distribution that describes the probabilities of the different possible outcomes when two fair six-sided dice are rolled.
The sum of two dice can take on values between 2 and 12, inclusive. The probability of each possible sum can be calculated using the following formula:
where X is the random variable representing the sum of two dice and k is a value between 2 and 12.
The number of ways to get a sum of k can be calculated by counting the number of ways that two dice can be rolled to get a sum of k. For example, there is only one way to get a sum of 2 (by rolling a 1 on each die), but there are multiple ways to get a sum of 7 (by rolling a 1 and a 6, a 2 and a 5, a 3 and a 4, or a 6 and a 1).
The total number of possible outcomes is simply the number of ways that two dice can be rolled, which is 6 x 6 = 36.
Using these formulas, we can calculate the probability distribution function for the sum of two dice:
This probability distribution function shows that the most likely sum of two dice is 7, which occurs with a probability of 6/36 = 1/6. The probabilities of the other possible sums decrease as we move away from 7. This probability distribution function is useful for analyzing games of chance that involve rolling two dice, and can also be used as an example of a discrete probability distribution in introductory statistics courses.
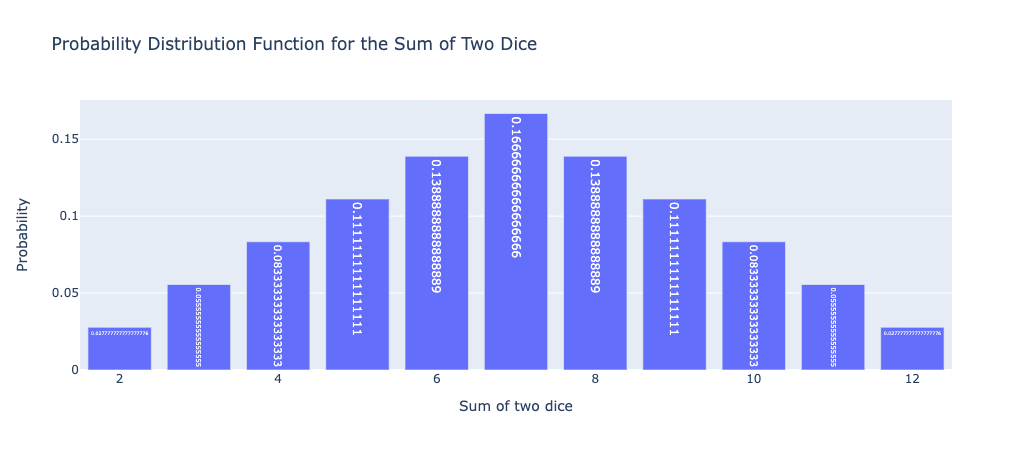
231import plotly.express as px2import pandas as pd3
4# Define the possible sums of two dice5sums = list(range(2, 13))6
7# Define the probabilities of each possible sum8probs = [1/36, 2/36, 3/36, 4/36, 5/36, 6/36, 5/36, 4/36, 3/36, 2/36, 1/36]9
10# Create a DataFrame to hold the data11data = pd.DataFrame({'Sum': sums, 'Probability': probs})12
13# Create a bar chart of the probability distribution function14fig = px.bar(data, x='Sum', y='Probability', text='Probability',15             title='Probability Distribution Function for the Sum of Two Dice')16
17# Set the x-axis and y-axis labels18fig.update_xaxes(title='Sum of two dice')19fig.update_yaxes(title='Probability')20
21# Show the plot22fig.show()23
Descriptive Statistics
Descriptive statistics is a branch of statistics that deals with the collection, analysis, and interpretation of data. It involves summarizing and describing the main features of a dataset, such as its central tendency, variability, and distribution. Descriptive statistics is an important tool in econometrics, as it allows econometricians to get a better understanding of the data they are working with.
Some common measures of descriptive statistics include:
Measures of central tendency: These measures describe the center of the dataset, or where the data tends to cluster. Common measures of central tendency include the mean, median, and mode.
Measures of variability: These measures describe how spread out the data is. Common measures of variability include the range, variance, and standard deviation.
Measures of distribution: These measures describe the shape of the dataset. Common measures of distribution include skewness and kurtosis.
Cross-tabulations: These are tables that show the distribution of two or more variables, allowing for comparisons and relationships to be identified.
Graphical representations: These are visual representations of the data, such as histograms, scatterplots, and boxplots, that allow for patterns and trends to be identified.
Descriptive statistics is an important first step in econometric analysis, as it provides insights into the characteristics of the data and can help inform the choice of statistical models and methods. By using descriptive statistics, econometricians can better understand the underlying patterns and relationships in the data, and can make more informed decisions about how to analyze it.
A normal versus a skewed distribution
Useful Algebra for Means, Variances and Covariances
In econometrics, it is often necessary to manipulate algebraic expressions involving means, variances, and covariances in order to derive statistical results and perform calculations. Here are some useful algebraic properties of means, variances, and covariances that are commonly used in econometrics:
Linearity of the mean: If
inearity of the variance: If
Additivity of variances: If X and Y are independent random variables, then the variance of their sum is given by
Multiplication of variances: If X and Y are independent random variables, then the variance of their product is given by
Additivity of covariances: If X, Y, and Z are random variables, then the covariance between X and Y plus the covariance between X and Z is equal to the covariance between X and (Y + Z):
These properties can be used to derive and manipulate algebraic expressions involving means, variances, and covariances, and can be particularly useful when working with statistical models and performing econometric calculations.
Types of Data and Data Aggregation
In the book "Introductory Econometrics for Finance" by Chris Brooks, there are broadly three types of data that can be employed in quantitative analysis of financial problems. These are:
Time-series data: This type of data consists of observations that are collected over a period of time, typically at regular intervals. Examples of time-series data in finance include daily stock prices, weekly exchange rates, or monthly inflation rates.
Cross-sectional data: This type of data consists of observations that are collected at a single point in time, typically from different individuals or entities. Examples of cross-sectional data in finance include data on individual stocks, bonds, or mutual funds, or data on different companies in a particular industry.
Panel data: This type of data combines both time-series and cross-sectional data, and involves tracking a group of individuals, companies, or other entities over time. Examples of panel data in finance include data on the performance of mutual funds over time, or data on the financial performance of different companies in a particular industry over time.
Each of these types of data has its own unique properties and challenges when it comes to analysis. Econometric techniques can be used to analyze each type of data and to uncover patterns and relationships that can be useful in understanding financial markets and making informed investment decisions.
Time-series data:
| Date | Apple Inc. Stock Price |
|---|---|
| 2022-03-01 | 148.36 |
| 2022-03-02 | 149.34 |
| 2022-03-03 | 148.93 |
| ... | ... |
Cross-sectional data:
| Company | Revenue (millions) | Profit (millions) | Market Share (%) |
|---|---|---|---|
| Apple Inc. | 274,515 | 57,411 | 14.4 |
| Microsoft | 195,240 | 47,519 | 9.6 |
| Amazon | 386,064 | 21,331 | 4.6 |
| ... | ... | ... | ... |
Panel data:
| Student ID | Year | Test Score | Attendance (%) | Gender |
|---|---|---|---|---|
| 001 | 2018 | 85 | 95 | Female |
| 001 | 2019 | 87 | 98 | Female |
| 001 | 2020 | 92 | 96 | Female |
| 002 | 2018 | 78 | 85 | Male |
| 002 | 2019 | 80 | 88 | Male |
| 002 | 2020 | 82 | 92 | Male |
These examples illustrate the different formats of data for each of the three types: time-series data, cross-sectional data, and panel data. In practice, the data may be much larger and more complex, but these examples give an idea of the type of information that can be included in each type of data.
Continuous and Discrete Data
In econometrics, data can be further classified into two types based on the nature of the variable: continuous and discrete data.
Continuous data refers to data that can take on any value within a certain range. Examples of continuous data include height, weight, temperature, and stock prices. Continuous data can be measured with great precision and can take on an infinite number of possible values. In econometrics, continuous data is often modeled using probability density functions, such as the normal distribution, and statistical techniques such as regression analysis.
Discrete data refers to data that can take on only a finite or countable number of values. Examples of discrete data include the number of people in a household, the number of cars sold by a dealership, and the number of employees in a company. Discrete data is typically measured using whole numbers or integers and cannot be measured with great precision. In econometrics, discrete data is often modeled using probability mass functions, such as the Poisson distribution, and statistical techniques such as count models.
Understanding whether the data is continuous or discrete is important in selecting appropriate statistical methods for analysis. The choice of statistical methods will depend on the type of data, the research question, and the assumptions underlying the statistical model.
Cardinal, Ordinal and Nominal Numbers
In econometrics, data can also be classified into three types based on the level of measurement: cardinal, ordinal, and nominal numbers.
Cardinal numbers: Cardinal numbers are numbers that represent a quantity or magnitude, and can be measured using a scale that has a true zero point. Examples of cardinal numbers include income, age, and weight. Cardinal numbers can be added, subtracted, multiplied, and divided, and can also be compared using inequality signs such as "greater than" and "less than". In econometrics, cardinal numbers are often used in regression analysis and other quantitative techniques.
Ordinal numbers: Ordinal numbers are numbers that represent a ranking or order, but do not have a true zero point. Examples of ordinal numbers include educational attainment (e.g., high school diploma, bachelor's degree, etc.), job status (e.g., entry-level, mid-level, senior-level), and satisfaction ratings (e.g., very satisfied, somewhat satisfied, etc.). Ordinal numbers can be ranked or ordered, but cannot be added or subtracted. In econometrics, ordinal numbers are often used in ordered probit and ordered logit models.
Nominal numbers: Nominal numbers are numbers that represent categories or classifications, and do not have any inherent ordering or ranking. Examples of nominal numbers include gender, race, nationality, and occupation. Nominal numbers cannot be ranked or ordered, nor can they be added or subtracted. In econometrics, nominal numbers are often used in logit and probit models.
Understanding the level of measurement is important in selecting appropriate statistical methods for analysis. The choice of statistical methods will depend on the type of data, the research question, and the assumptions underlying the statistical model.
Future Values and Present Values
In finance and economics, future values and present values are important concepts that are used to compare the value of money over time.
Future value (FV) is the value of an investment or cash flow at a future point in time, given a specified interest rate or rate of return. The future value can be calculated using the following formula:
where PV is the present value of the investment, r is the interest rate or rate of return, and n is the number of time periods.
Present value (PV) is the value of an investment or cash flow at the present time, given a specified interest rate or rate of return. The present value can be calculated using the following formula:
PV = FV / (1 + r)^n
where FV is the future value of the investment, r is the interest rate or rate of return, and n is the number of time periods.
These formulas can be used to compare the value of money over time, and to determine whether an investment is worth making. For example, if you are considering investing $1,000 today at an interest rate of 5% per year, you can use the future value formula to determine how much the investment will be worth in 5 years:
FV =
Similarly, if you are considering an investment that will pay $1,000 in 5 years at an interest rate of 5% per year, you can use the present value formula to determine how much the investment is worth today:
PV =
These concepts are important in many areas of finance and economics, including investment analysis, capital budgeting, and financial planning.
Histogram
The book "Introductory Econometrics for Finance" by Chris Brooks explains a histogram as a graphical representation of the distribution of a numerical variable. A histogram is a way of summarizing the distribution of a variable by dividing the data into a set of intervals, called bins or classes, and counting the number of observations that fall into each bin.
The x-axis of the histogram shows the range of values for the variable being analyzed, while the y-axis represents the frequency or count of observations that fall within each bin. The bins or classes should be chosen in a way that captures the variability of the data without creating too few or too many bins.
Histograms can be used to visualize the shape of the distribution of a variable, including whether it is skewed to the left or right, symmetrical, or has multiple modes. They can also be used to identify outliers or unusual values in the data.
In the book, histograms are used to illustrate the distribution of variables such as stock returns, interest rates, and exchange rates. The author provides examples of how to create histograms in Excel and Stata, as well as how to interpret them for various types of data.
If you'd like to learn more about histograms and how to create them using Excel or Stata, the following resources may be helpful:
Excel tutorial on creating histograms: https://www.excel-easy.com/examples/histogram.html
Tabulating Numerical data: Frequency Distribution
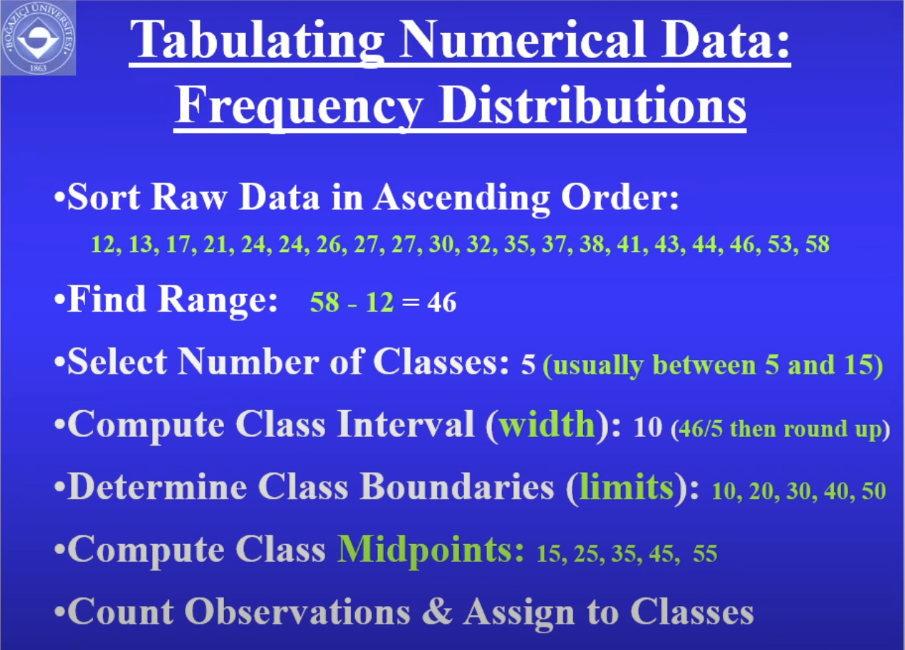
Frequency distribution is an important method used in econometrics to summarize numerical data. It involves tabulating the number of observations that fall into each category, or range, of values in a dataset.
To create a frequency distribution, you can follow these steps:
Determine the range of values in the dataset. This will help you determine the size of the categories (or bins) you will use in the frequency distribution.
Create a table with the categories as rows and the number of observations in each category as columns. You can use Excel or other software to help you create the table.
Count the number of observations that fall into each category and enter them into the corresponding cell in the table.
Calculate the percentage of observations that fall into each category by dividing the number of observations in each category by the total number of observations in the dataset and multiplying by 100.
You can also add cumulative frequencies and cumulative percentages to the table to show the total number of observations that fall below a certain value and the percentage of observations that fall at or below a certain value.
Here's an example of a frequency distribution table:
| Category | Frequency | Percentage | Cumulative Frequency | Cumulative Percentage |
|---|---|---|---|---|
| 0-10 | 5 | 25% | 5 | 25% |
| 11-20 | 8 | 40% | 13 | 65% |
| 21-30 | 4 | 20% | 17 | 85% |
| 31-40 | 3 | 15% | 20 | 100% |
This table shows the frequency distribution of a dataset with 20 observations that range from 0 to 40. The first column shows the categories, or bins, which range from 0-10, 11-20, 21-30, and 31-40. The second column shows the number of observations that fall into each category, the third column shows the percentage of observations in each category, and the last two columns show the cumulative frequency and cumulative percentage.
I hope this helps! Let me know if you have any further questions or if you need any additional resources.
Sort Ascending
Find Range (min-max)
# of Classess
Compute width (class interval)
Detemind boundaries (limits)
Computer midpoint
Count
Excel Practices
Creating Histogram for a simple dataset
| Data |
|---|
| 58 |
| 13 |
| 17 |
| 21 |
| 24 |
| 24 |
| 26 |
| 27 |
| 27 |
| 30 |
| 32 |
| 35 |
| 37 |
| 38 |
| 41 |
| 43 |
| 44 |
| 46 |
| 53 |
| 12 |
| 65 |
Then we sort the data in ascending order:
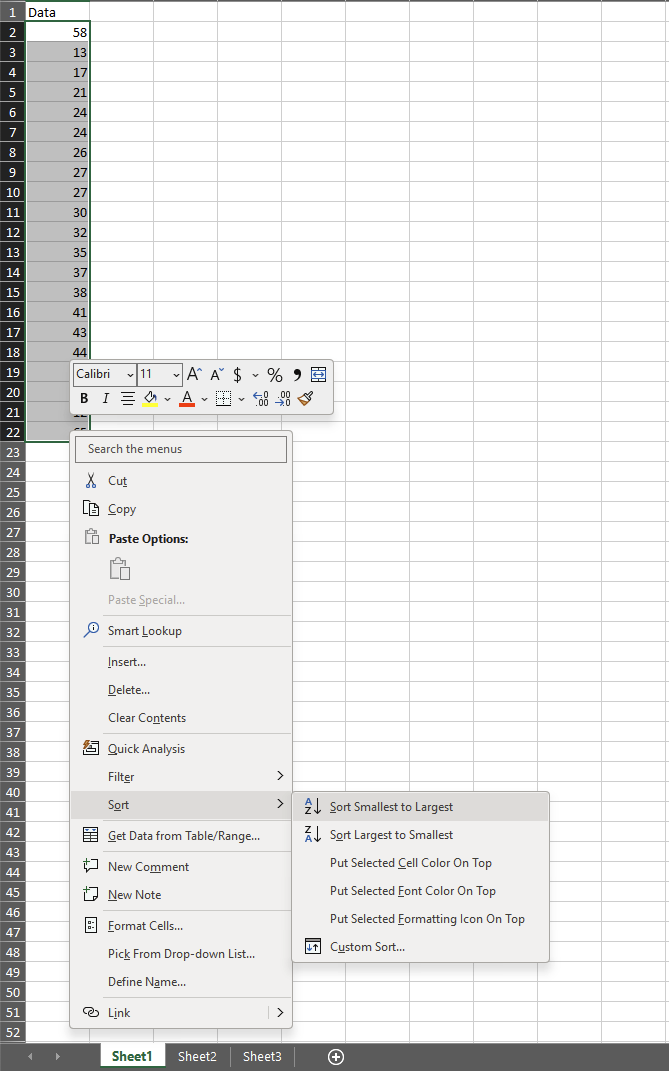
Then we provide the bin range:
| Data | Bin range | |
|---|---|---|
| 12 | 20 | |
| 13 | 30 | |
| 17 | 40 | |
| 21 | 50 | |
| 24 | 60 | |
| 24 | ||
| 26 | ||
| 27 | ||
| 27 | ||
| 30 | ||
| 32 | ||
| 35 | ||
| 37 | ||
| 38 | ||
| 41 | ||
| 43 | ||
| 44 | ||
| 46 | ||
| 53 | ||
| 58 | ||
| 65 |
Then we use the Histogram tool from data analysis:
Then we use the histogram tool to create the histogram:
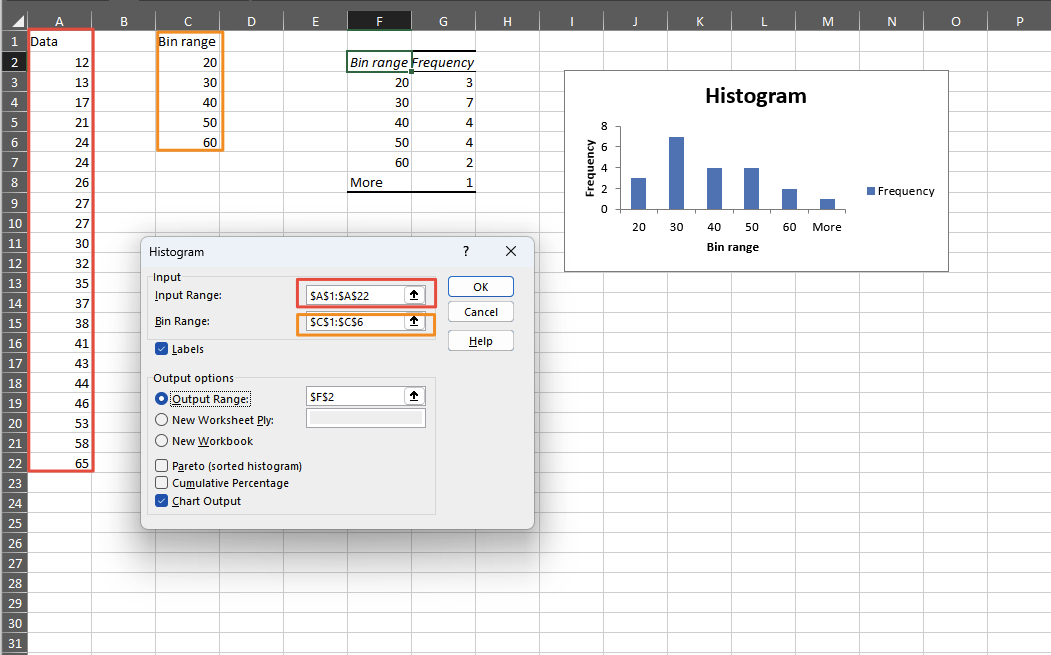
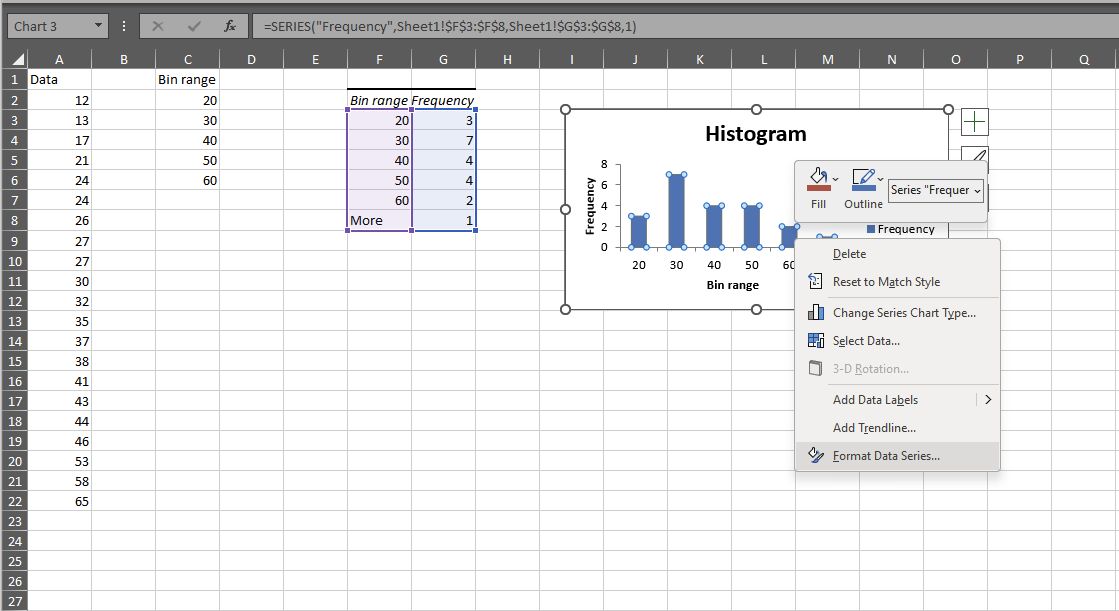

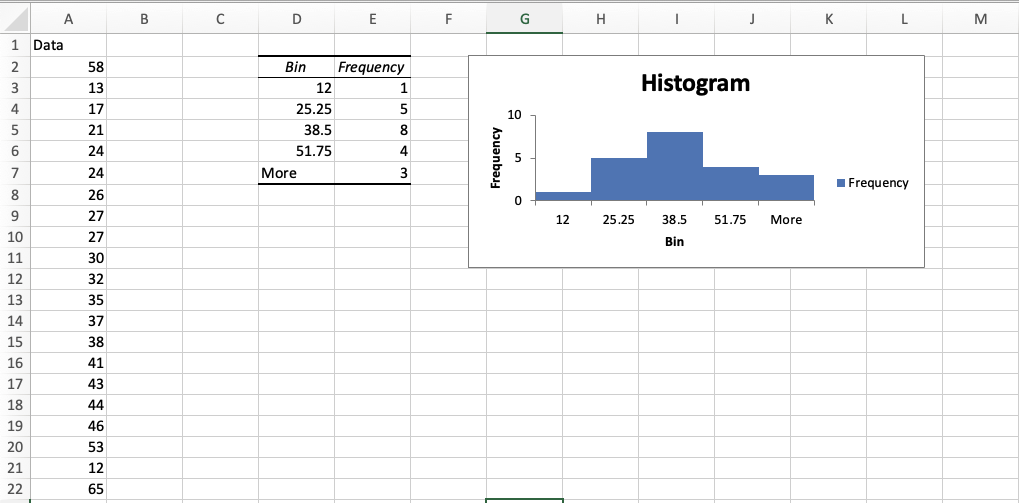
We can left the bin range empty and let the excel calculate it:
Question (EXAM): Why we would like to expacially in clasical statistics would like to achieve a normal distribution shape ? Why we do all kind of data transfrmation to achieve a normal distributed data? Why we use central midterm theroem to approxmate other distribution to normal one ? what is the aim of that?
In classical statistics, the normal distribution is important because it is a common distribution that many natural phenomena and processes tend to follow. It is also important because it has several convenient mathematical properties that make it easy to work with, such as the fact that it is completely described by its mean and standard deviation.
There are several reasons why we might want to transform data to achieve a normal distribution shape:
Normality assumption: Many statistical tests and models assume that the data follow a normal distribution. For example, linear regression models assume that the residuals (the differences between the actual and predicted values) are normally distributed. By transforming the data to achieve a normal distribution, we can meet this assumption and use these tests and models.
Statistical efficiency: When data are normally distributed, statistical tests and models are often more efficient and accurate. This means that we can get more precise estimates and make better predictions.
Interpretability: Normal distributions are easier to interpret because we know the exact probabilities of values falling within a certain range. This can be useful in making decisions and drawing conclusions.
There are several methods for transforming data to achieve a normal distribution, such as logarithmic, square root, and Box-Cox transformations. The aim of these transformations is to create a new distribution that is as close to normal as possible, while preserving the relationships between the variables.
The central limit theorem is used to approximate other distributions to normal one. The central limit theorem states that the sampling distribution of the sample mean approaches a normal distribution as the sample size increases, regardless of the shape of the population distribution. This means that if we take many samples of the same size from a population, the distribution of the sample means will tend to be normal. This is important because it allows us to use normal distribution properties to make inferences about the population based on the sample mean.
SP500 Example